U.S. Population + Housing Infographic
Infographic, Adobe Illustrator
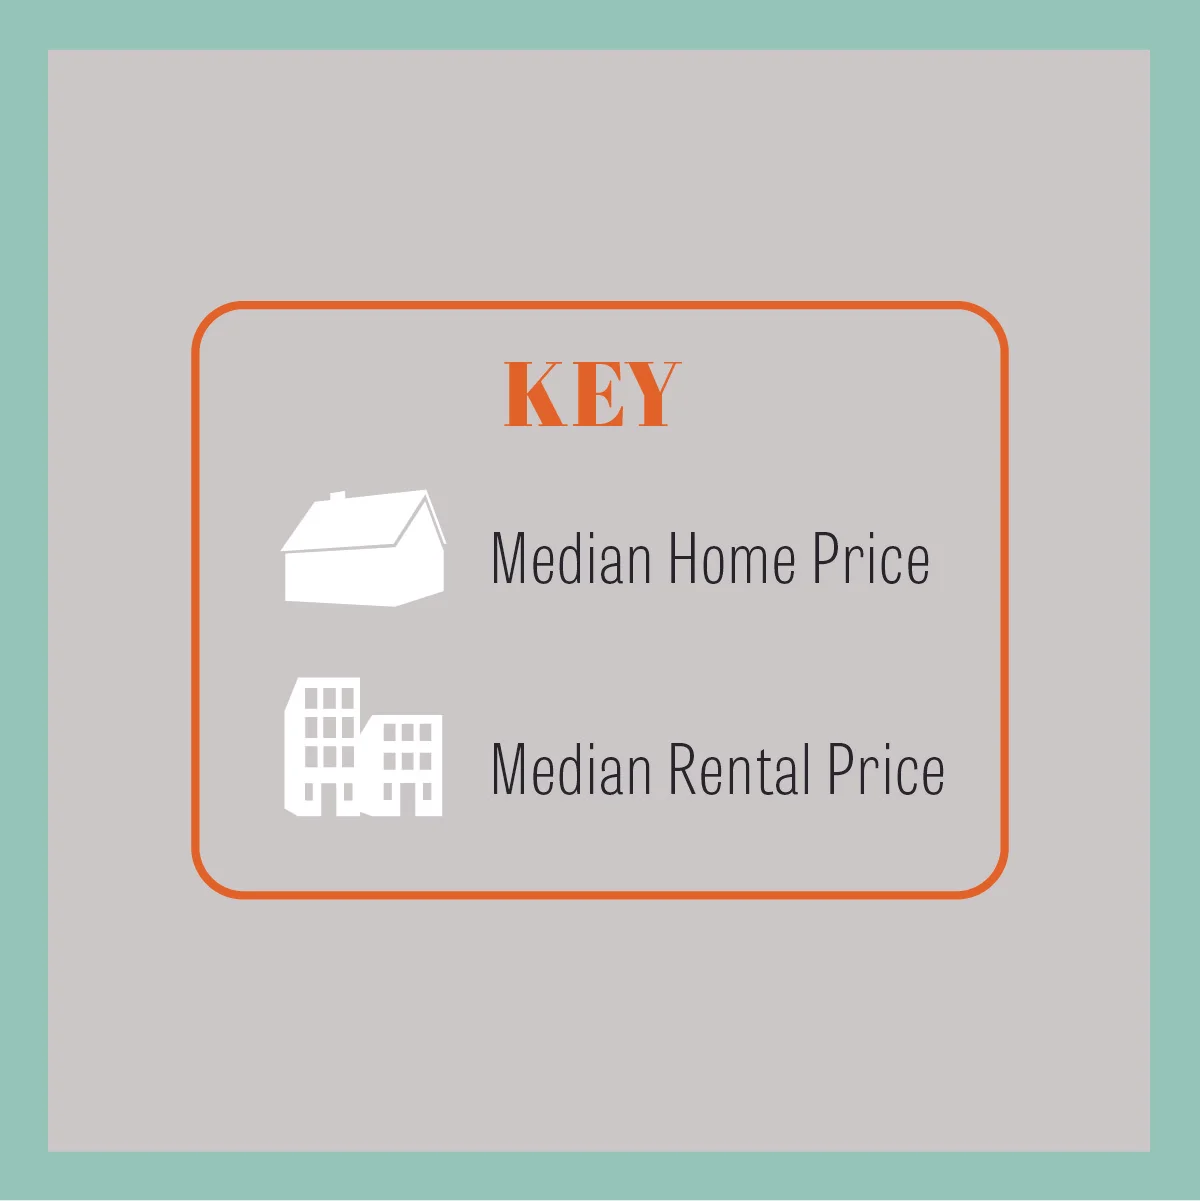
This infographic was created based on information from the U.S. Census website, for the period between the 2010 census and the estimated 2018 data. It shows the population, median housing value, and median rent costs for the top 10 largest U.S. cities. The entire infographic is custom designed, including the different icons and map design.
Key for Infographic
Custom “bubble” caption for each city


